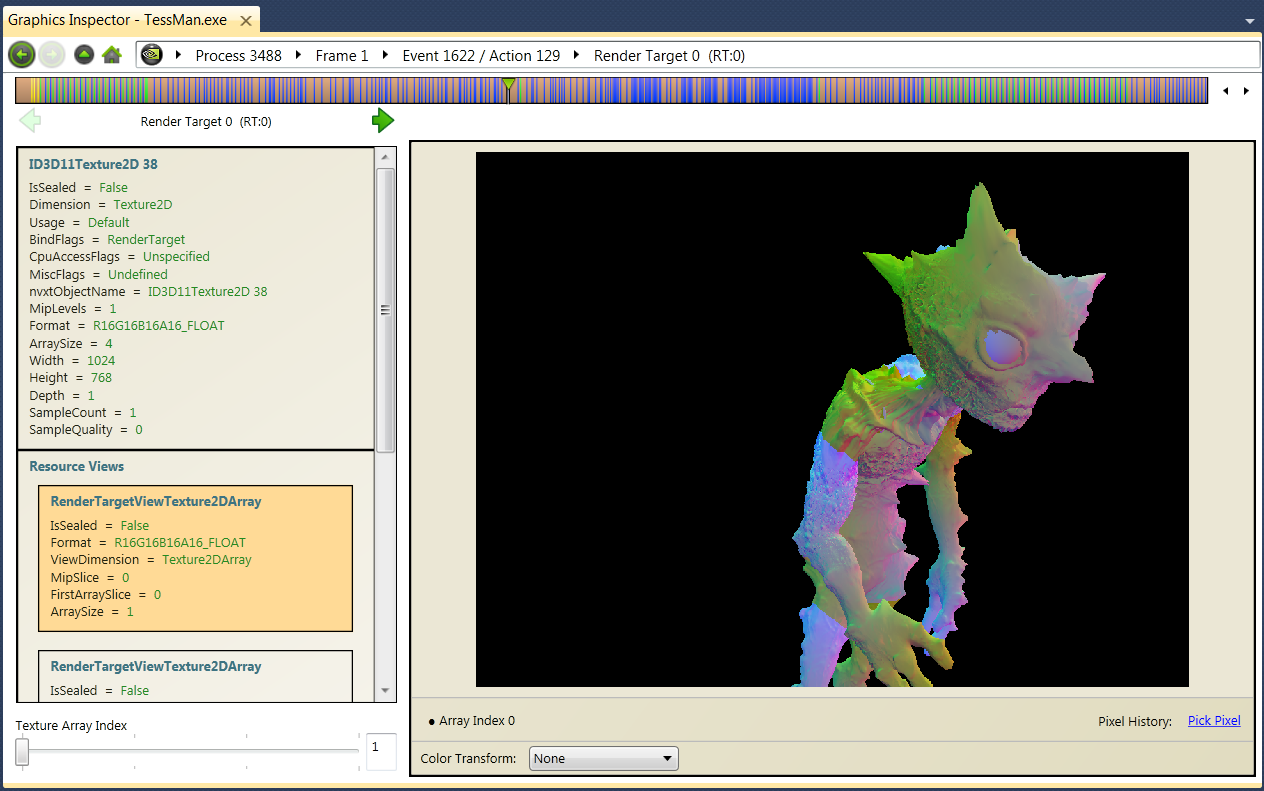
- Click on the render target image.
- Move the scroll wheel on the mouse to zoom in and out.
- Click and drag the render target image to move the image up and down, and side to side.
NVIDIA® Nsight™ Development Platform, Visual Studio Edition 2.2 User Guide
Send Feedback
The NVIDIA Nsight Shader Debugger allows you to inspect which draw events contributed to a pixel’s values up to the currently selected event.
To view Pixel History:
To see the draw call page for a particular draw call, click on the corresponding Draw Call link in the left-hand pane.
To open the source code of the draw call, click on the corresponding Debug Pixel link in the left-hand pane.

|
Pixel history can only be used when your system is configured for remote debugging. |
| NVIDIA® Nsight™ Development Platform, Visual Studio Edition User Guide Rev. 2.2.120522 ©2009-2012. NVIDIA Corporation. All Rights Reserved. | |