
|
You cannot debug a shader with a local debugging configuration; you must configure your system for remote debugging. |
NVIDIA® Nsight™ Development Platform, Visual Studio Edition 2.2 User Guide
Send Feedback
The NVIDIA Nsight Shader Debugger tools allow you to perform source-level debugging of various HLSL shader types.
|
|
You cannot debug a shader with a local debugging configuration; you must configure your system for remote debugging. |
To access the Shader Debugger:
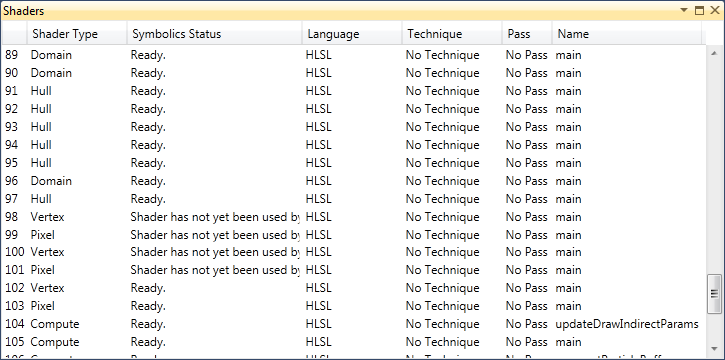
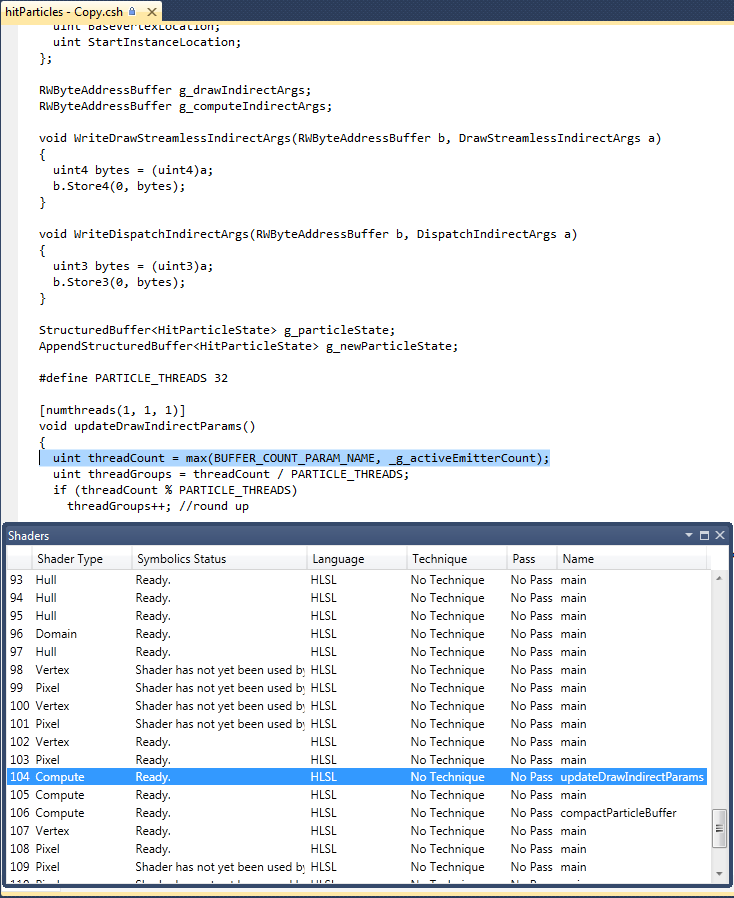
The following table shows the possible states of the Symbolics Status:
Status Meaning Ready The shader can be debugged. Shader has not yet been used by the application The shader is created, but it has not been used by the application. That means that it cannot yet be debugged. No symbols have been loaded for this shader The shader cannot yet be debugged. This usually happens during startup when the debugger is still loading a defined shader, but has not yet loaded the debug symbolics required for debugging. Not a debuggable shader The shader cannot be debugged. The shader was likely submitted as a binary shader compiled without debug information, which means that the instructions being executed cannot be mapped to the original HLSL source code.

In order to debug shaders and use the Pixel History functionality, NVIDIA Nsight needs access to the original HLSL source code of your shaders. There are a few ways to accomplish this task. The first is to submit the HLSL source at startup time and compile your shaders, using D3DXCompileShader, D3DX10CompileFromFile, etc. NVIDIA Nsight can intercept these calls to gain access to the HLSL source code and display it for debugging.
Alternatively, you can precompile the shaders into binary format using the same functions and saving the results out to a file, or use the offline compiler, fxc.exe, provided by the DirectX SDK. However, using this method, you need to specify some flags in order for the HLSL debug information to be embedded in the binary output, outlined below:
D3DXCompileShader Compiler Flag (using fxc.exe) D3DXSHADER_PREFER_FLOW_CONTROL /Gfp D3DXSHADER_DEBUG /Zi D3DXSHADER_SKIPOPTIMIZATION /Od
| NVIDIA® Nsight™ Development Platform, Visual Studio Edition User Guide Rev. 2.2.120522 ©2009-2012. NVIDIA Corporation. All Rights Reserved. | |