NVIDIA® Nsight™ Development Platform, Visual Studio Edition 2.2 User Guide
Send Feedback
Most graphics debugging elements of NVIDIA Nsight, such as viewing textures and render targets, are the same for a Direct3D 9 application as they are for a Direct3D 10 or Direct3D 11 application.
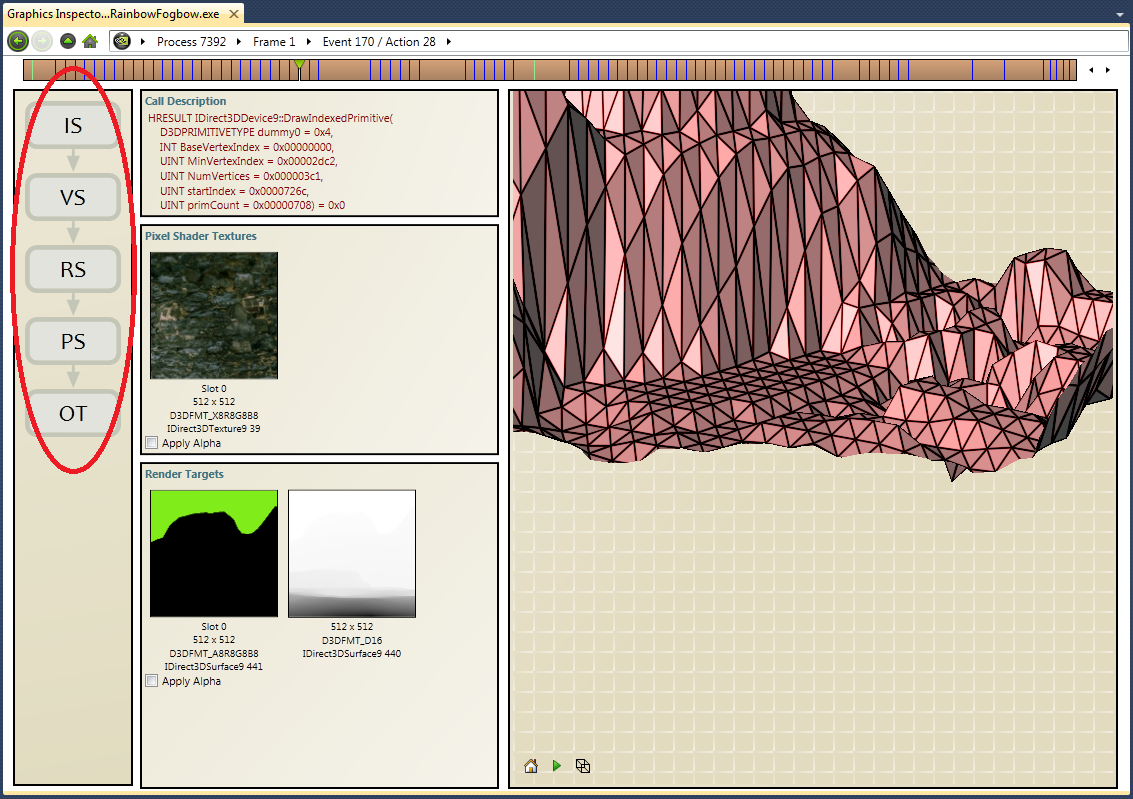
However, when debugging a Direct3D 9 application, you will notice that the available pipeline states (the pipeline information of a specific draw event) are different from their Direct3D 10/11 counterparts.
To view pipeline states for a Direct3D 9 application:
The available pipeline states for a Direct3D 9 application are detailed below.
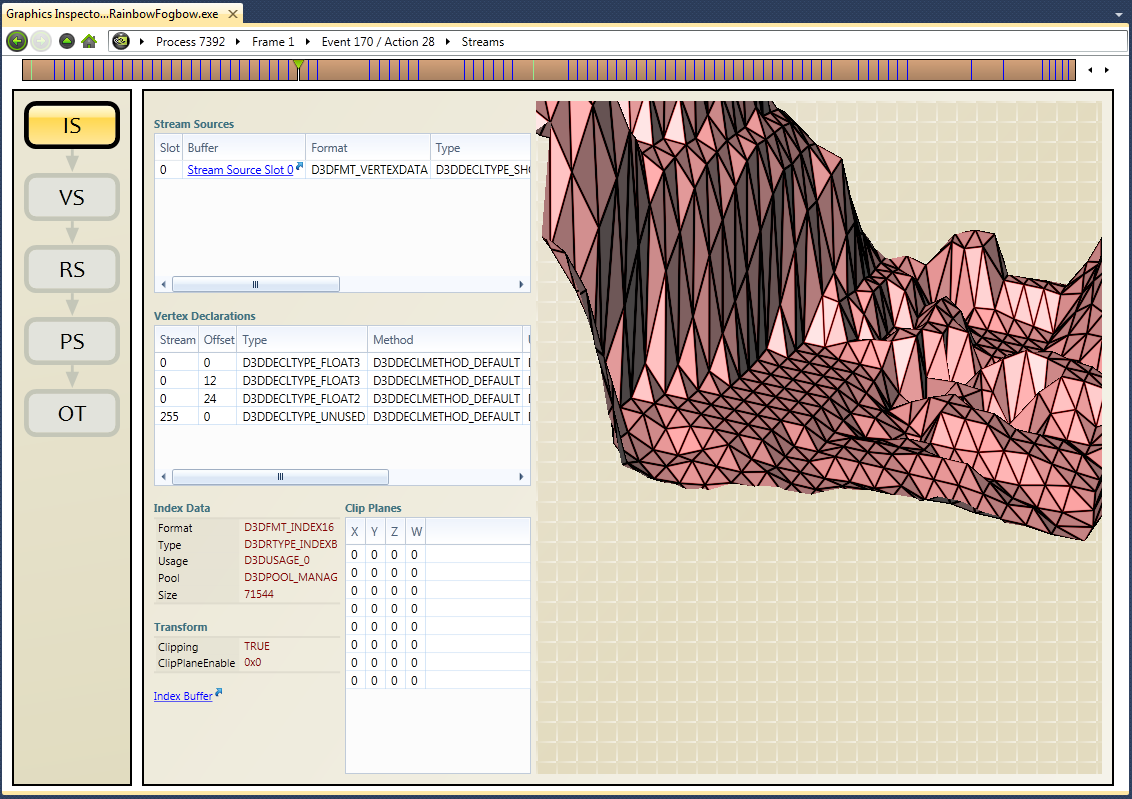
The Streams page shows the layout of your vertex buffers and index buffers, along with a pre-transform rendering of the primitives.
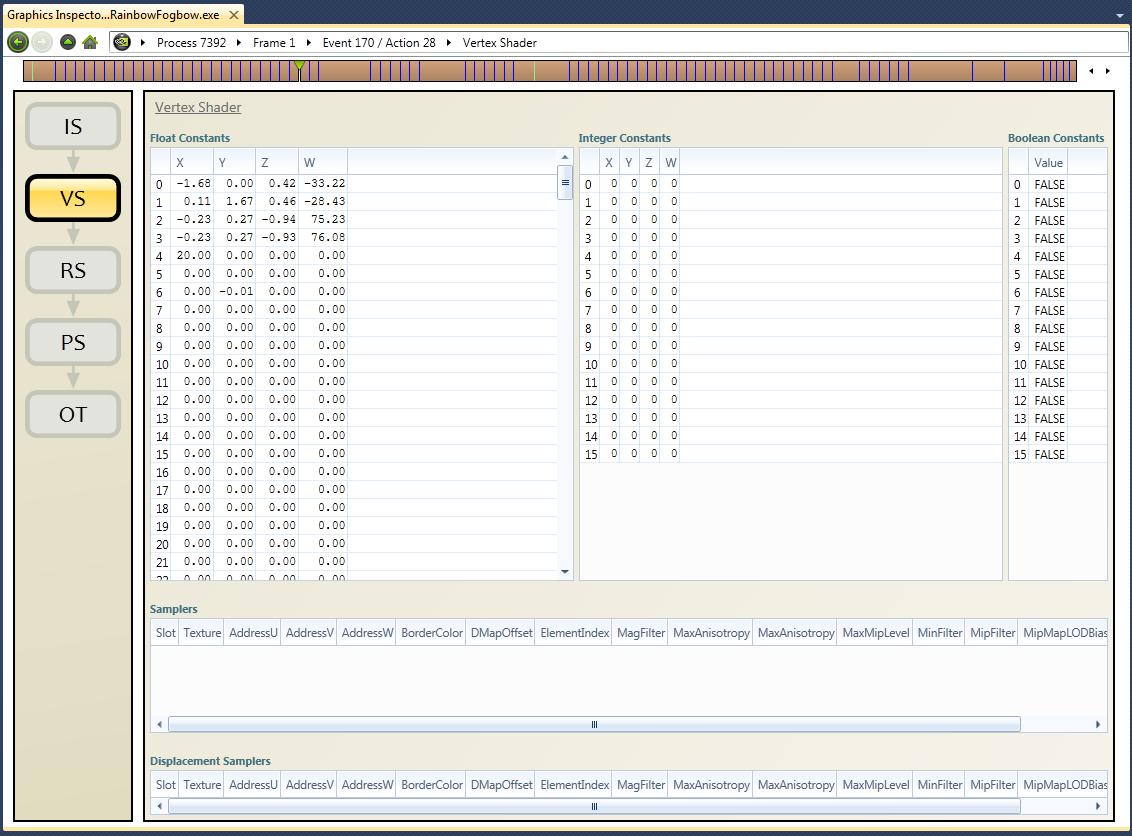
The Vertex Shader page has a link to the shader, the list of constants, and any bound texture samplers.
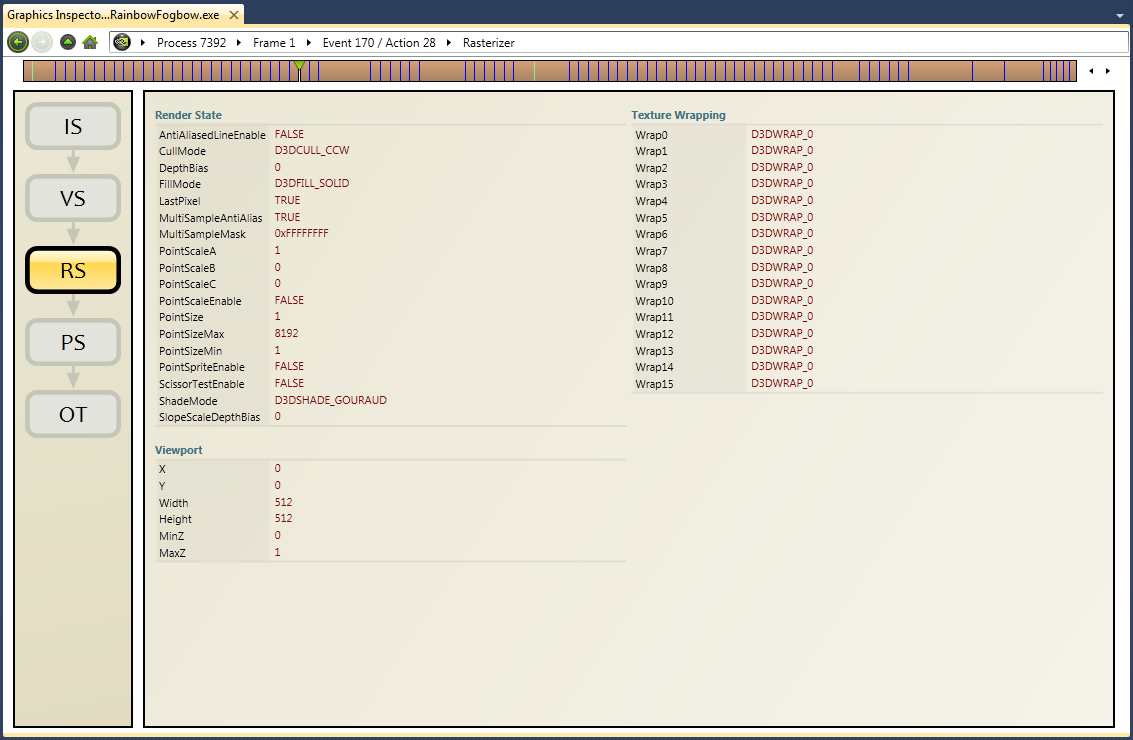
The Rasterizer State page displays render state settings, texture wrapping modes, and viewport information.
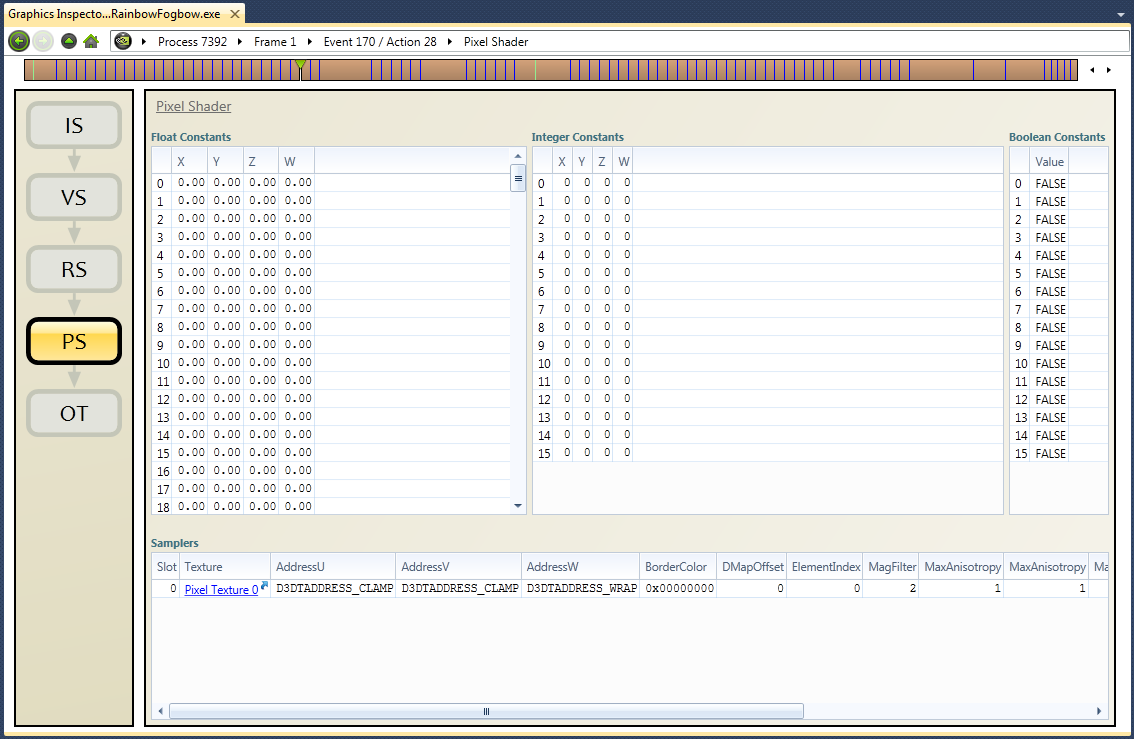
The Pixel Shader page has a link to the shader, the list of constants, and any bound texture samplers.
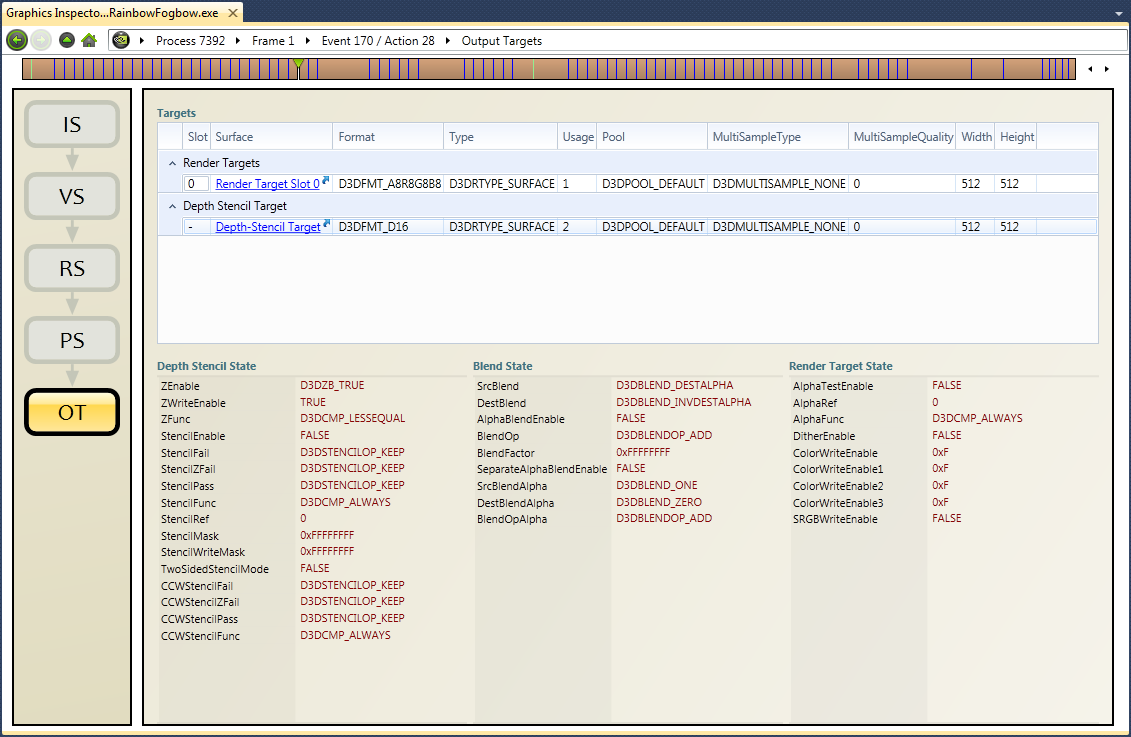
The Output Targets page displays parameters such as blending setup, depth, and stencil states.
| NVIDIA® Nsight™ Development Platform, Visual Studio Edition User Guide Rev. 2.2.120522 ©2009-2012. NVIDIA Corporation. All Rights Reserved. | |