While the Frame Profiler provides a thorough deep dive into your draw calls, NVIDIA Nsight also provides a Frame Timings page that simply provides the GPU cost for a given draw call, which is much faster.
To view frame timings:
- Start the Frame Debugger.
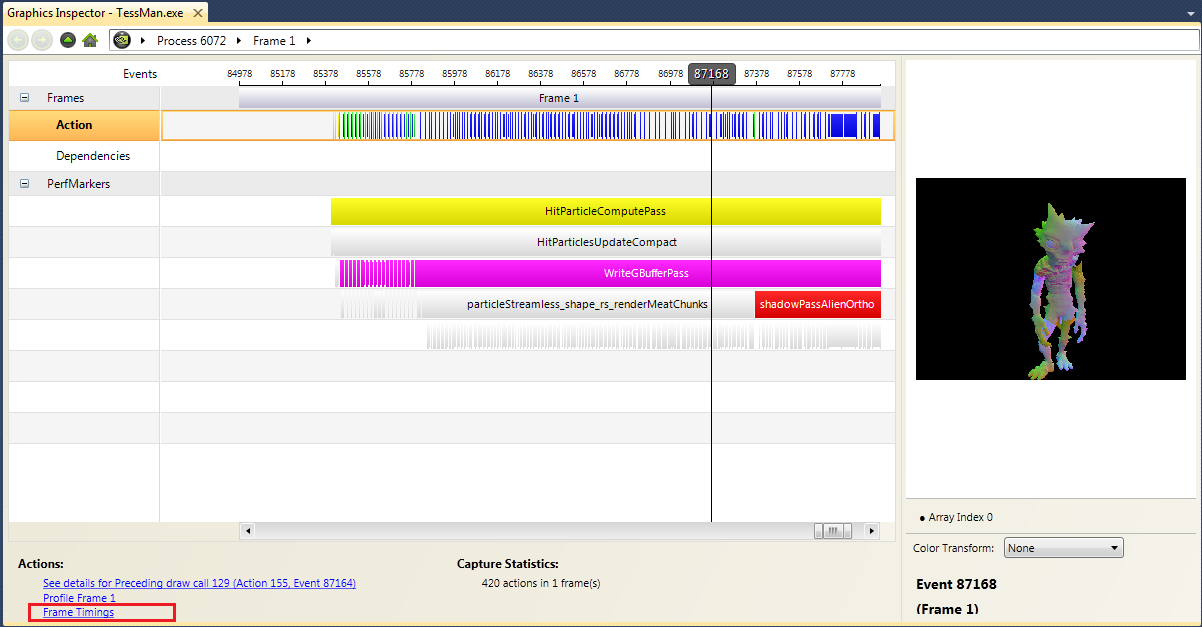
- Click on the link that reads Frame Timings.

- The Frame Timings page appears.

- The save icon on the top left allows you to save the frame timings session to compare it against future frame timings.
To open a previously saved frame timings session, go to File > Open, and select the *.nvgfxtimings file.
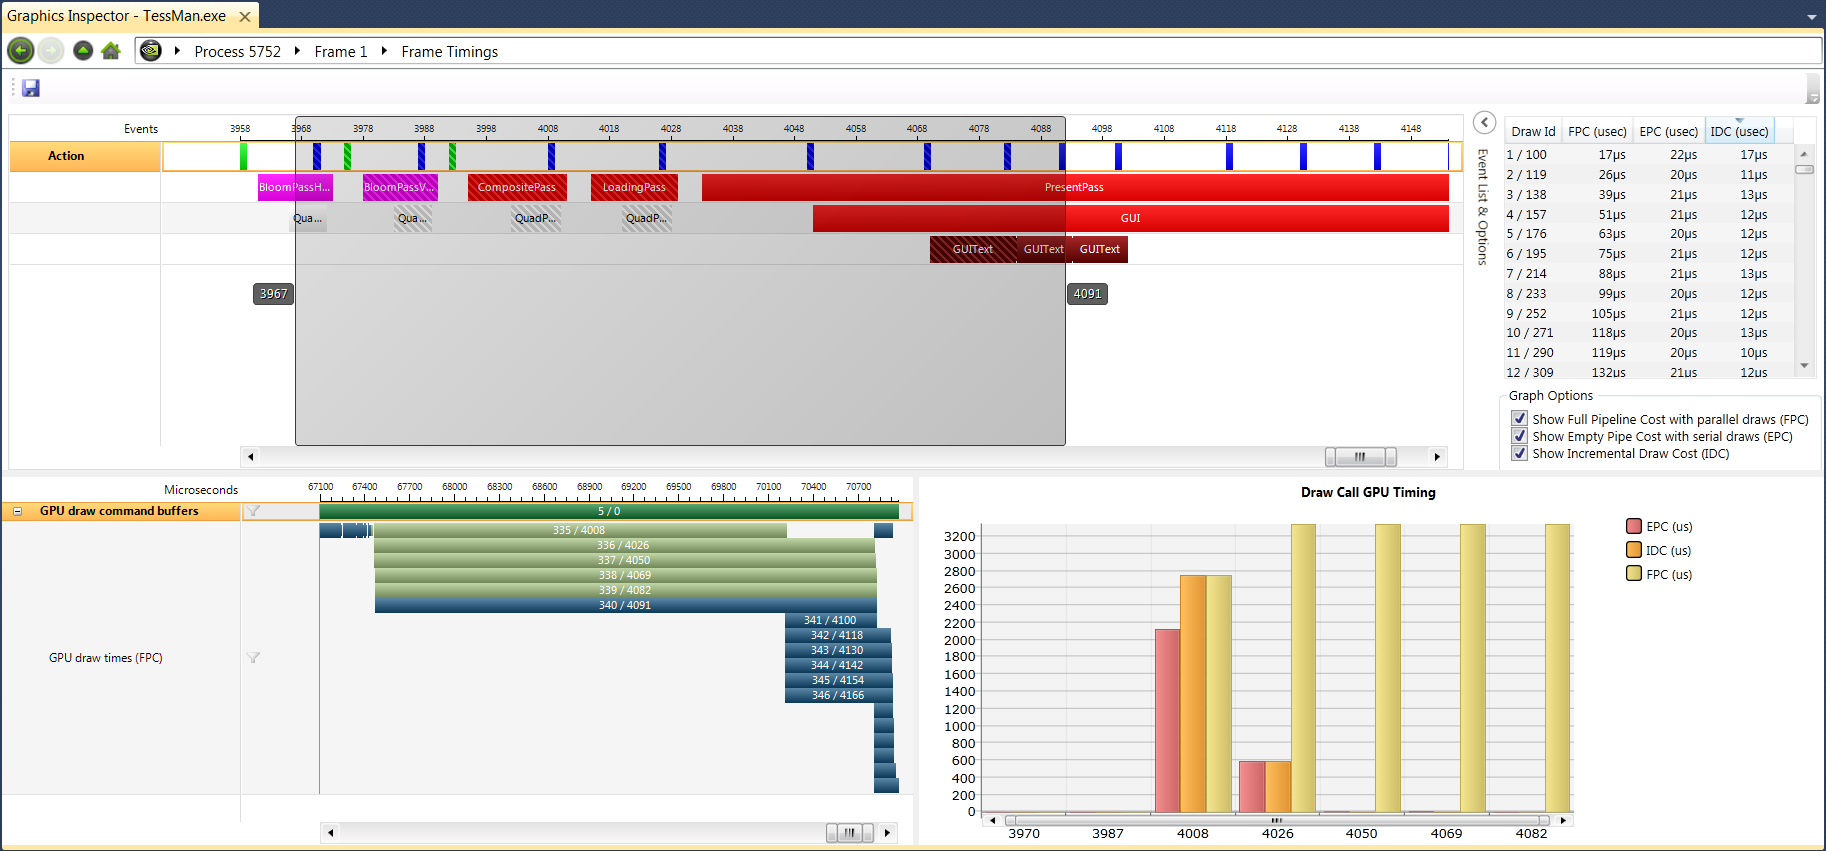
- The top-left half of the Frame Timings window shows you an overview of your frame, and allows you to zoom in on a group of draw calls, in the same way as the Frame Scrubber.
If you select a perf marker, all of the draw calls inside that perf marker are selected in the graphs below, helping to visualize the draw calls for that section of rendering.
- On the top-right is the Event List & Options slide-out, which displays a list of the frame timings for each draw call, and also allows you to select the timings you want to graph (see below).
- The graph on the lower-left shows the start time and duration for the command buffers and draw calls. As seen above, many draw calls can overlap their start and stop times. This illustrates the concurrency available in the GPU with many draw calls in flight at any given moment.
- On the lower-right is a graph that shows the three different timings measured:
- Empty Pipeline Cost (EPC) - The cost of the draw call when isolated on the GPU. This value shows how much a given draw call costs by itself, not taking into account contention for resources with other draw calls.
- Full Pipeline Cost (FPC) - The cost of the draw call while other draw calls are in flight. This is important because it shows the impact of the other work that is being processed while the draw call in question is rendering.
- Incremental Draw Cost (IDC) - This is the incremental cost of a given draw call. Because of the bandwidth of the GPU pipeline, many draw calls can be processed in parallel, resulting in little to no frame rate hit when you add a draw call.
| NVIDIA® Nsight™ Development Platform, Visual Studio Edition User Guide Rev. 2.2.120522 ©2009-2012. NVIDIA Corporation. All Rights Reserved.
|
|
| |
|

