NVIDIA® Nsight™ Development Platform, Visual Studio Edition 2.2 User Guide
Send Feedback
Launching an application from the activity document initiates a capture session. For each capture session, the analysis tool creates a directory to collect reports, named with application's name, the date, and an incrementing session number to discriminate between multiple sessions on the same day. Each time you start and stop capture during the session, a new capture subdirectory will be created in the session directory. The files in that directory comprise a capture report, and these files can opened in Visual Studio by NVIDIA Nsight on any computer, so you can zip and email your capture reports for others to view. These are the types of files you will find in a capture directory:
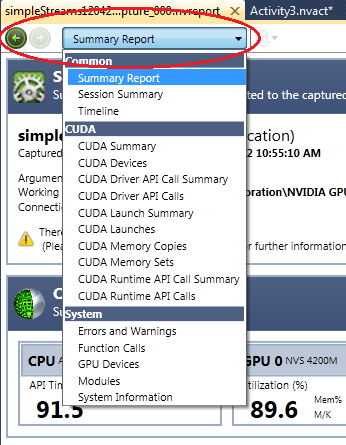
You can open a capture report in Visual Studio with NVIDIA Nsight either by directly opening the .nvreport file, or by enabling the option it your activity to automatically open the capture report as soon as capturing ends. The report and its log files contain a vast amount of information, which NVIDIA Nsight helps you navigate. The report is represented as a hierarchy of pages, each of which focuses on a specific aspect of the capture data. There are several ways to navigate through the report pages. You can use the navigation bar at the top to jump to a specific page:
You can also navigate to report pages by clicking links in other pages. For example, at the bottom of the Summary page, there is a link to the Timeline page.
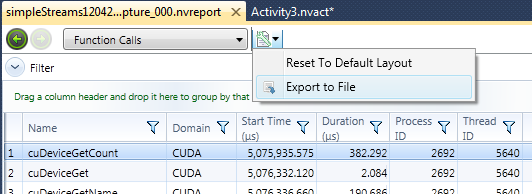
Many of the report pages display data in a table. All of the pages using this format support the same rich set of features: you can show/hide columns, sort by any column, regroup the rows by common values from any column, and create filters to limit the visible data. You can export the visible data to a file, so you can load it in a spreadsheet tool or automated test system.
Report tables can be exported into the following formats: Excel XML, HTML, CSV, and plain text (*.txt).
Capture reports use three types of report pages:
- Summary Page - a synopsis of the data recorded during a single capture session. For more information, see Summary Report.
- Table Pages - there are several kinds of detailed reports that show information in a table format, such as time spent in each function, number of calls to each function, etc. For more information, see Detailed Reports.
- Timeline Page - shows events captured from API instrumentation (CUDA, Direct3D, OpenCL, NVTX), Windows kernel events (CPU core usage, context switches, thread states), and GPU events (CUDA kernels, Direct3D draw calls) visually along a timeline that spans the duration of the capture. You can quickly navigate and zoom the timeline using the mouse or keyboard, and detailed information is provided for selected events. For more information, see Timeline Report.
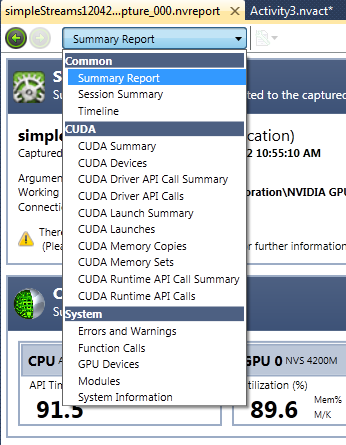
At the top of each report document is a drop-down menu that allows you to choose which analysis report you would like to view. There are also "back" and "forward" buttons which can be used to navigate to previously viewed reports.
| NVIDIA® Nsight™ Development Platform, Visual Studio Edition User Guide Rev. 2.2.120522 ©2009-2012. NVIDIA Corporation. All Rights Reserved. | |