NVIDIA® Nsight™ Development Platform, Visual Studio Edition 2.2 User Guide
Send Feedback
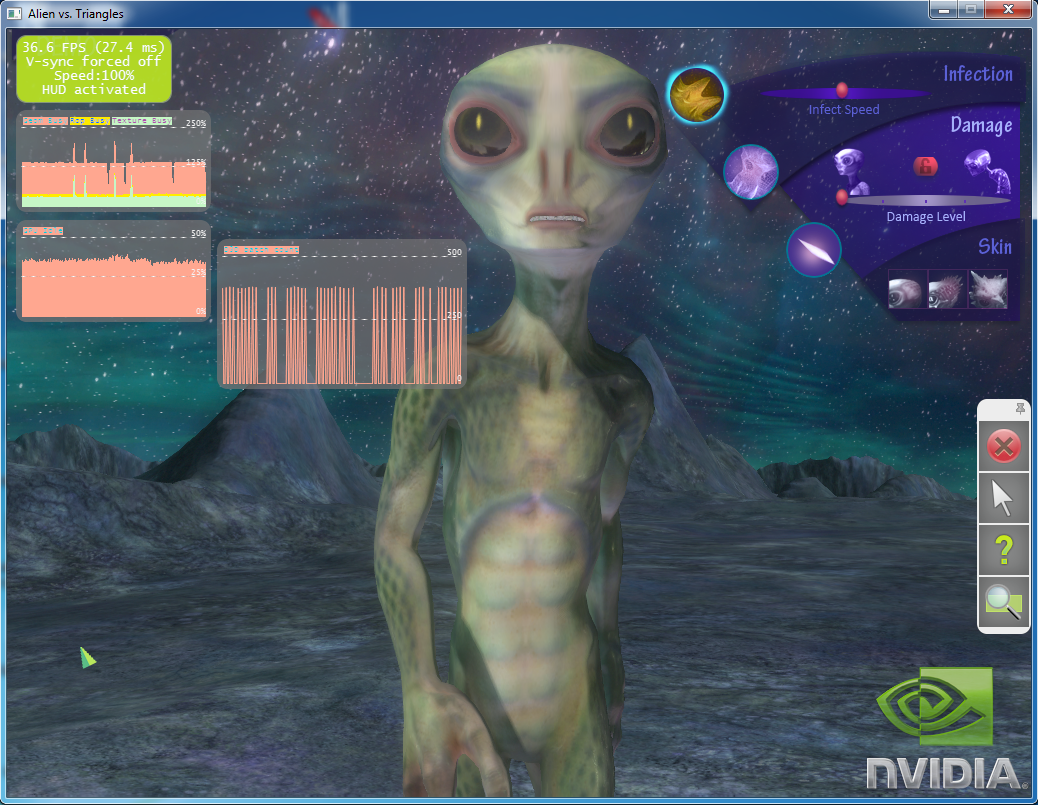
When you start debugging your graphics application in Visual Studio, the target computer will begin running the application. You will notice several performance graphs and a HUD toolbar overlaid on top of your application. At this point, your application is considered to be in run mode.
The HUD can be used to run the following experiments while in run mode:
There are two different methods to pause the application, which causes it to enter frame debugger mode.
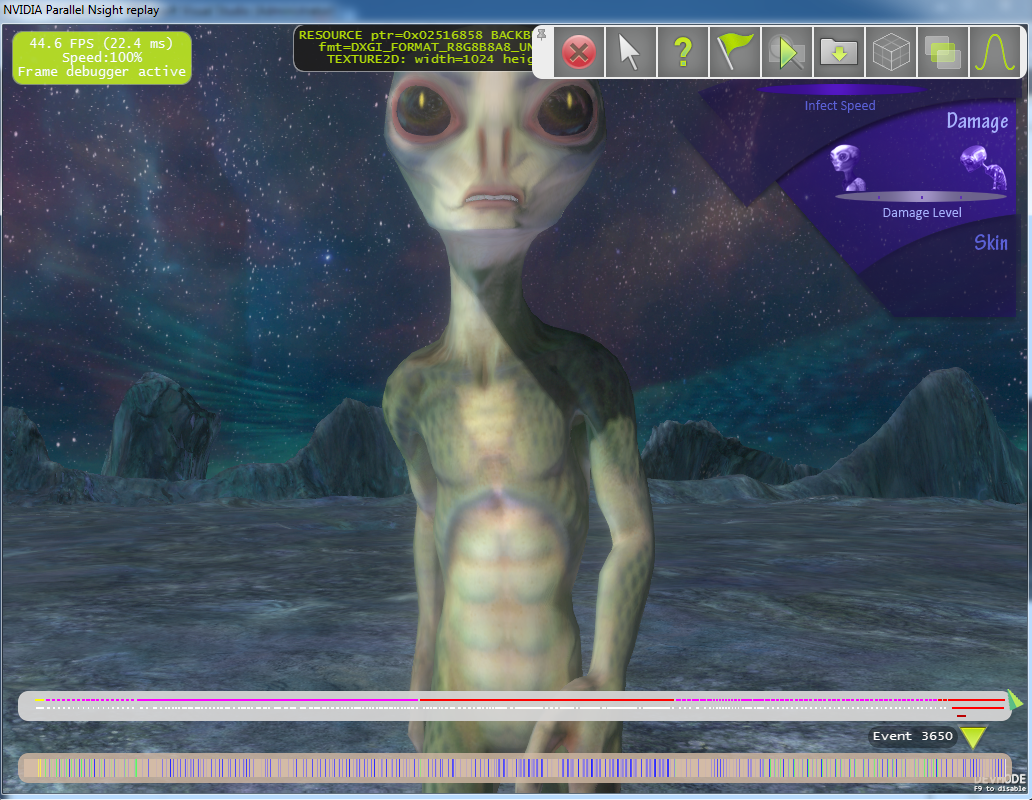
After you enter Replay Mode, you will see several features overlaid on top of the application, such as timelines of draw call events and performance markers. Perhaps the most notable of these features is the HUD Toolbar, which allows you to work with your application on the target computer itself.
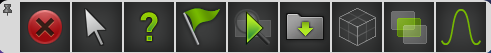
HUD ICON DEFINITION

Hides the GUI so you can view more of your application. 
Switches between a hardware and software cursor. 
Displays the Help menu, showing all available commands.

Selects a view of event ranges. 
Exits the frame debugger and resumes your application. 
Saves a frame capture to a file. By default, files are saved to: Documents\NVIDIA Nsight\Captures
Changes the current object wireframe rendering method. 
Changes the current render target display from the color buffer to depth or stencil. 
Toggle the normalization view of the depth/stencil texture display.
| NVIDIA® Nsight™ Development Platform, Visual Studio Edition User Guide Rev. 2.2.120522 ©2009-2012. NVIDIA Corporation. All Rights Reserved. | |