NVIDIA® Nsight™ Development Platform, Visual Studio Edition 2.2 User Guide
Send Feedback
The Frame Profiler is a powerful tool in the Graphics Inspector that can help you optimize rendering of your Microsoft Direct3D 11, 10.1, or 10 application. Once you have captured and profiled a frame, the Frame Profiler shows CPU and GPU execution times, as well as GPU hardware unit utilization and bottlenecks on a per draw call basis. Understanding how your draw calls utilize the actual GPU hardware is invaluable in optimizing your rendering data and code.
The Frame Profiler also includes unmatched data mining capabilities that allow you do group draw calls both by common state, such as pixel or vertex shader, and by Microsoft Direct3D performance markers.
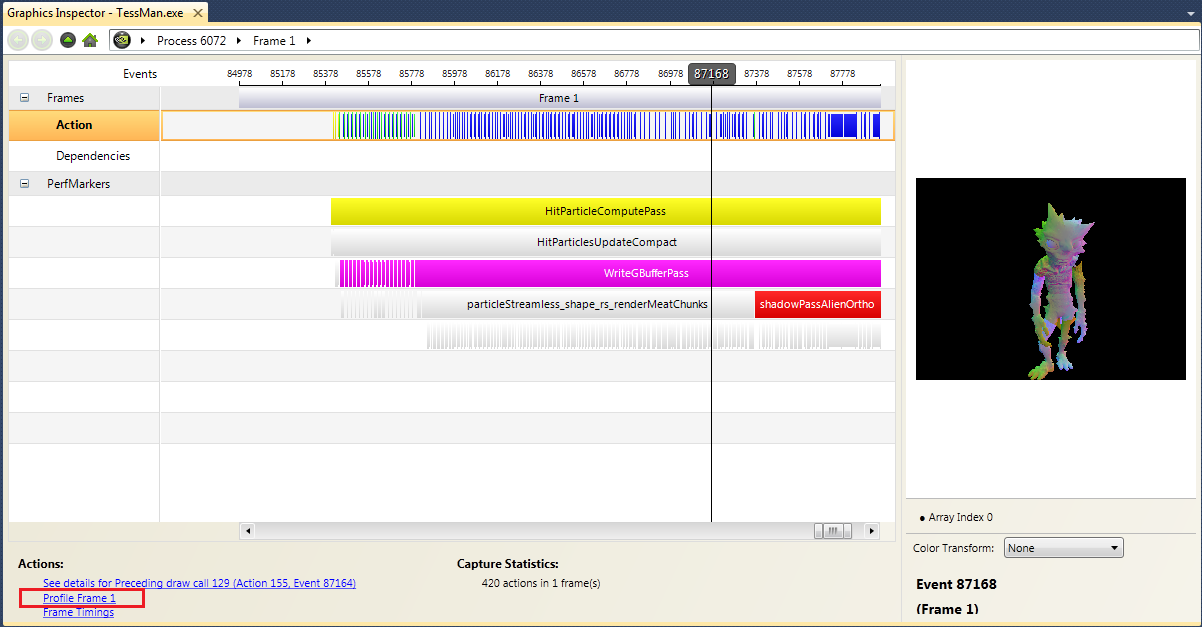
To profile a graphics frame:
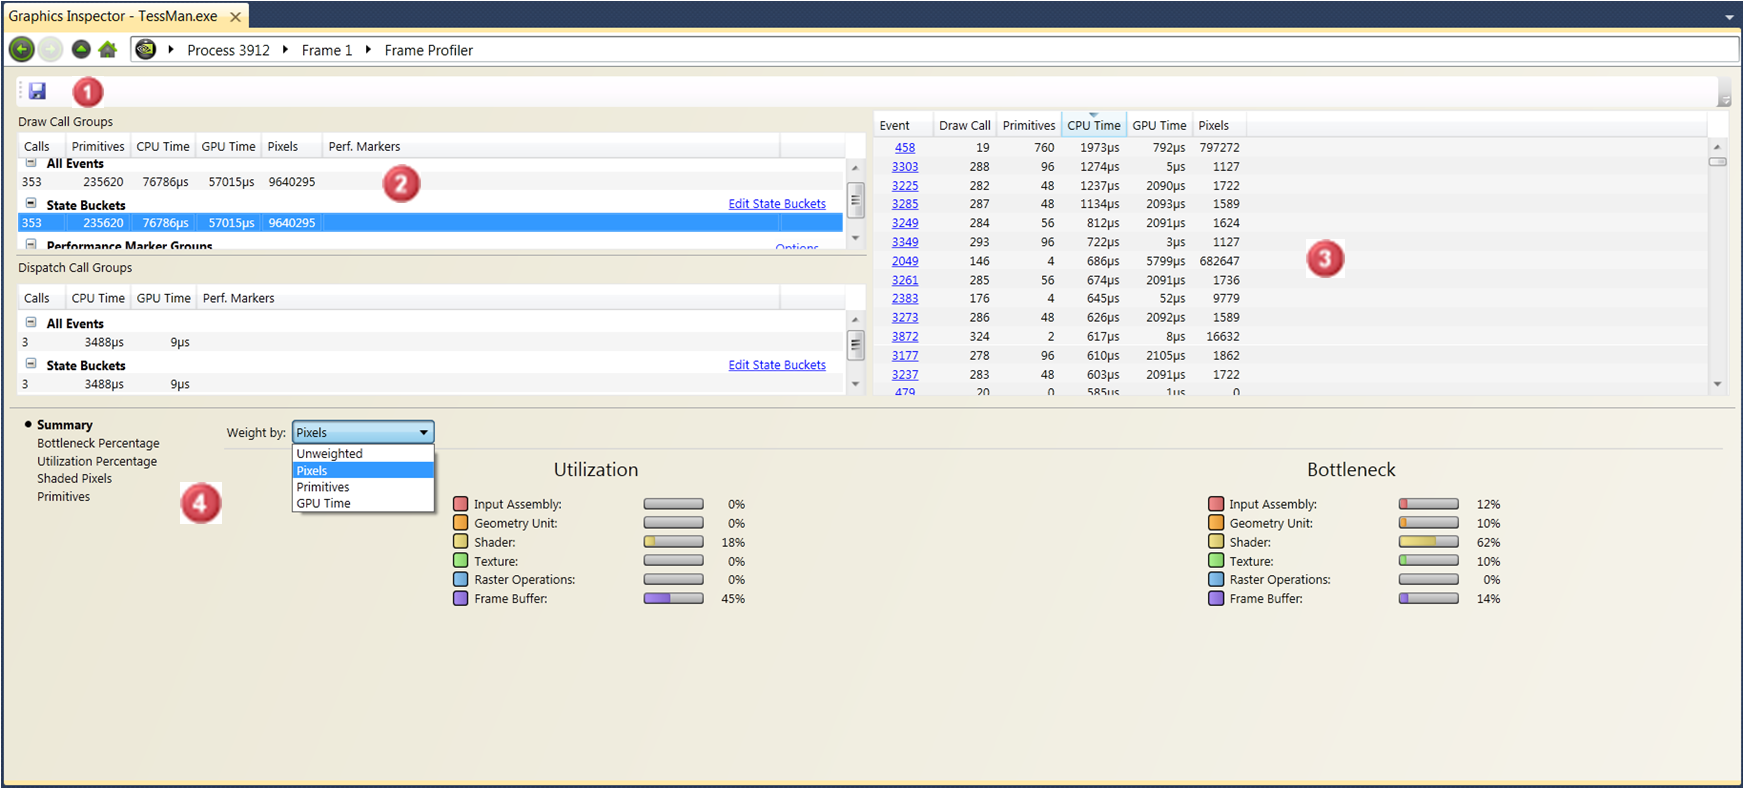
The Frame Profiler page has four main parts: Save Profiler Results, Draw Call Groups, Draw Calls table, and the Performance Graph.
 Save and Load Profiler Results
On the top-left of the Frame Profiler screen is a save icon. This will save your frame profiler session so it can be accessed later, to compare it against another frame profiler session.
To access the saved frame profiler session, go to File > Open, and select the appropriate
*.nvgphxfile. The saved file acts almost exactly as a live frame profiler sessions You can edit state buckets and make other modifications while in the saved session.
 Draw Call Groups
The Draw Call Groups table allows you to group draw calls in your frame, which can give you deeper insight into your frame's performance characteristics. The Frame Profiler allows you to group by draw call state, and by Direct3D Performance Marker. By default, the Draw Call Groups table also includes a default group, All Events, which includes all draw calls in the frame. Both the Draw Calls table and the Performance Graphs will only show draw calls from the selected state bucket in this table.
Column Label Description Calls The number of calls in the Draw Call Group on this row. Primitives The total number of primitives rendered across all calls in the Draw Call Group. CPU Time The total amount of CPU time the draw calls in the group needed to execute. GPU Time The total amount of GPU time the draw calls in the group needed to execute. Pixels The total number of shaded pixels the draw calls in the group shaded. Perf Markers Any Direct3D performance markers associated with the group. This column only has data when a group based on a performance maker is defined.
This table can be sorted in either ascending or descending order by any column value by clicking on the column header.
State Buckets
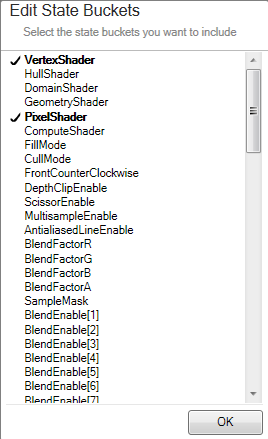
Grouping draw calls by state allows you to see draw calls which use a common state(s) or asset(s), like a pixel or vertex shader. Optimizing the common asset can reduce GPU execution time across all draw calls in the state bucket.
Direct3D Performance Marker Groups
Grouping draw calls by their Direct3D Performance Markers allows you to see draw calls that are in any Direct3D performance marker interval in your frame.
Creating a Draw Call Group based on Microsoft Direct3D performance markers
- In the Draw Call Groups table, click the Options button to the right of the Performance Marker Groups node.
- Select Add Perf Marker Group from the context menu.
A dialog will open showing you all Direct3D performance markers in your frame.- Click on any Direct3D performance markers for which you'd like to create groups.
For more information on using Microsoft Direct3D Performance Markers, please see: http://msdn.microsoft.com/en-us/library/microsoft.directx_sdk.reference.d3dperf_beginevent%28VS.85%29.aspx
 Draw Calls Table
The Draw Calls table displays information on each draw call in the selected state bucket.
Column Label Description Index The index of this draw call. Clicking on the linked indices in this column will navigate you to the full Draw Call page for this specific call. Primitives The number of primitives rendered by this draw call. CPU Time The amount of CPU time this draw call needed to execute. GPU Time The amount of GPU time this draw call needed to execute. Pixels The number of shaded pixels this draw call shaded. GPU Idle The value of the GPU Idle hardware performance counter during this draw call. This table can be sorted in either ascending or descending order by any column value by clicking on the column header.
 Performance Graphs
The Performance Graph area visualizes performance data about the selected state bucket. There are 5 different graphs available:
1. Summary The Summary displays weighted-average utilization and bottleneck percentages for each GPU unit, over all draw calls in the selected state bucket. Weighing the draw call's contribution by different factors allows you to optimize your application's performance based on image contribution. By examining each type of graph, you can rule out any possible issues by seeing the cost of a given area of the screen, bottlenecks for the most expensive draw calls, and any other performance inhibitors. The types of summary graphs include the following:
- Unweighted - Weight the contribution of each draw call uniformly.
- Pixels - Weight the contribution of each draw call by the number of pixels shaded by the draw call.
- Primitives - Weight the contribution of each draw call by the number of primitives in the draw call.
- GPU Time - Weight the contribution of each draw call to the unit utilization and bottleneck percentages by the amount of execution time for the draw call.
2. Bottleneck Percentage
This graph shows the hardware unit bottleneck percentages for each draw call in the selected state bucket.3. Utilization Percentage
This graph shows the hardware unit utilization percentages for each draw call in the selected state bucket.4. Shaded Pixels Graph
This graph shows the number of shaded pixels rendered by each draw call in the selected state bucket, and the % coverage for each draw call. Draw calls which write only the depth buffer, or otherwise have a large percentage of fragments rejected by early-Z will have a correspondingly small number of shaded pixels.5. Primitives Graph
This graph shows the number of primitives rendered by each draw call in the selected Draw Call Group.
| NVIDIA® Nsight™ Development Platform, Visual Studio Edition User Guide Rev. 2.2.120522 ©2009-2012. NVIDIA Corporation. All Rights Reserved. | |