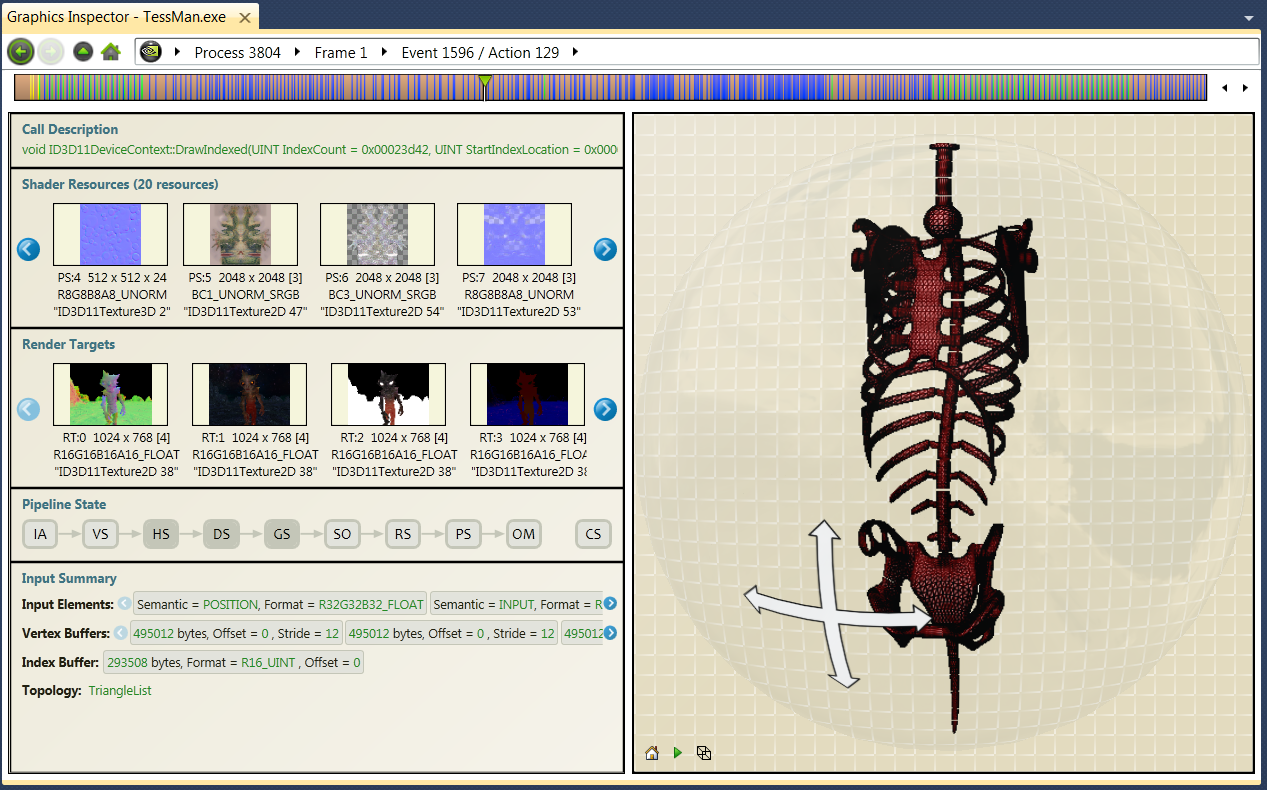
The draw call page opens showing the details of the draw call.


NVIDIA® Nsight™ Development Platform, Visual Studio Edition 2.2 User Guide
Send Feedback
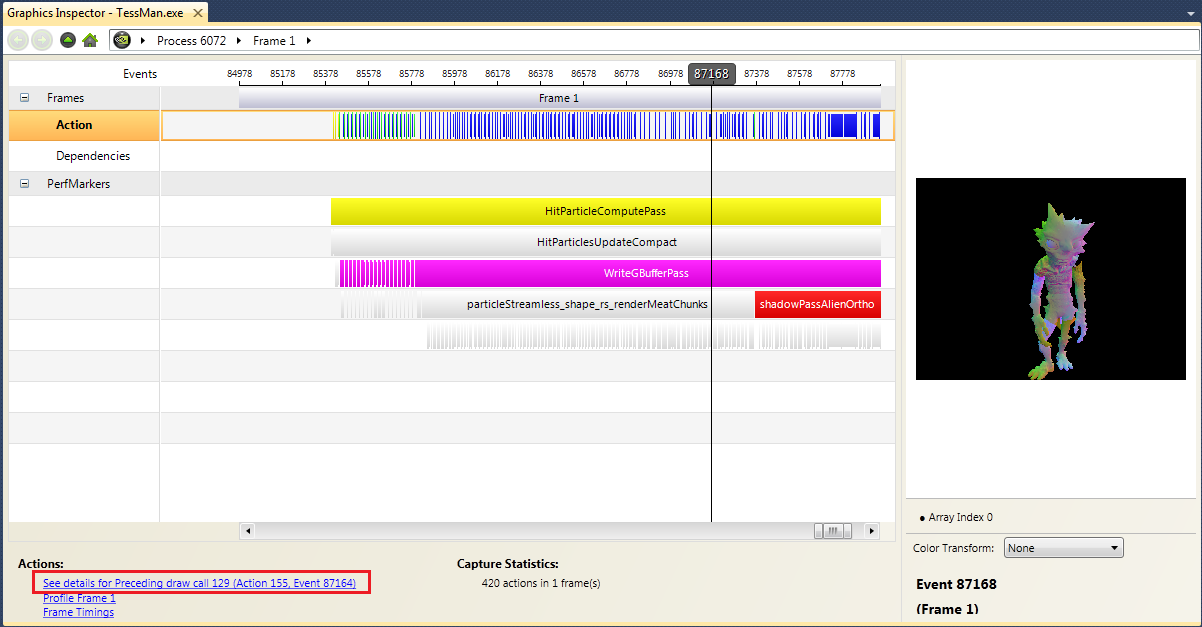
When using the Frame Debugger feature of NVIDIA Nsight, you may wish to do a deep dive into the specific draw calls in order to analyze your application further.
To use the API Inspector:


| NVIDIA® Nsight™ Development Platform, Visual Studio Edition User Guide Rev. 2.2.120522 ©2009-2012. NVIDIA Corporation. All Rights Reserved. | |